
“Measuring for Proof of Compliance -vs- Process Feedback” |
|||||||||||||||||||||||||||||
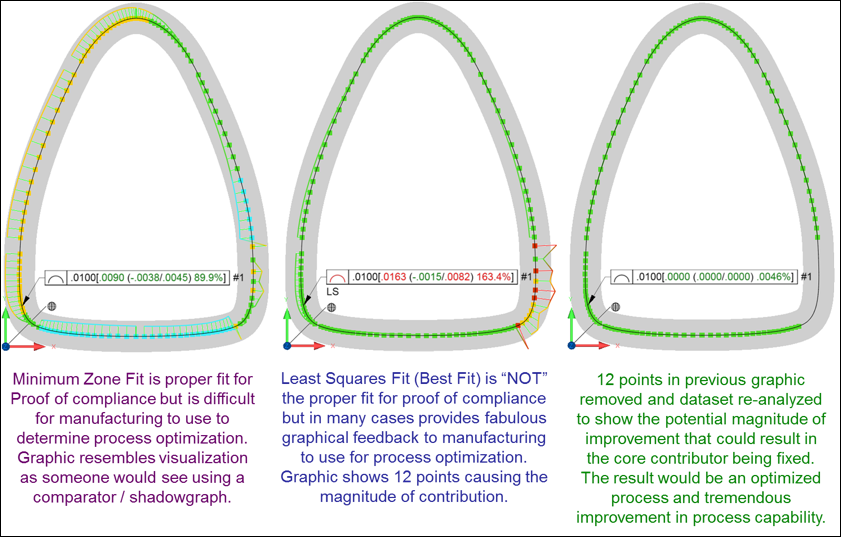
| When I first started as an inspector I thought my job was principally to determine if a manufactured part conformed to the specification requirements defined on the engineering drawing. If the part conformed I would accept/release the parts to the next operation or to be shipped, however if the part did not conform I would write my multiple copy non-conformance sheet and distribute copies to the interested party and put the parts on hold for members of the management team and technical staff to review. What I did not understand was that a significant part of my job was to provide feedback to the manufacturing engineers and machinists so they could truly understand the problem and put them in a better position to know how to fix it and/or optimize their process. This was all assuming my measurements were always correct, which I determined based on doing a measurement repeatability and reproducibility study. Sadly, I did not know at the time that many of my measurements were repeatably and reproducibly less than optimal and included biases I was not aware of, which also meant I did not know how to correct for them. How often has manufacturing received measurement data from the quality group that has been of little use to aid manufacturing in determining how to solve the manufacturing problem? The 2D example below is an example of the quick analysis (with the proper software) that can be completed to provide value to both quality and to manufacturing. In the figure below, the result on the left is the optimal results quality is looking for from a proof of compliance perspective (minimum zone fit) while the result in the middle is what manufacturing is looking for from a process optimization perspective (least squares fit) to know what to fix. Historically the values (not the graphics) is what manufacturing receives from quality and are based on the default algorithms (least squares) used in the majority of CMM software’s used in industry today. The result of this feedback would reject the part (in this case) or show a larger portion of the tolerance used than desired. The implications of this would motivate manufacturing to indicate to design engineering that they are not able to optimally meet the specification tolerance and encourage the designer to undesirably increase the allowable tolerance. By providing the graphic in the middle it can clearly be seen by the manufacturing engineer that it is only the lower right corner of the part that shows excessive variation would could simply be caused by 1) built up in a molding die, 2) break down in a stamping die, 3) interpolation error in a milling process. It is even possible that it was not a manufacturing problem as it potentially could have been caused by the measurement process due to contamination on the part or build up on a probing sphere. All considerations worth evaluating prior to any consideration of discussing the topic with the designer. |
|||||||||||||||||||||||||||||
 |
|||||||||||||||||||||||||||||
By removing the 12 points identified in the middle graphic and re-analyzing the dataset we can see the the potential magnitude of improvement that could result in the core contributor being fixed, resulting in an optimized process and tremendous improvement in process capability. |
|||||||||||||||||||||||||||||
| Individuals that require more in-depth knowledge on this topic along with other insight to the ASME Y14.5 standards are encouraged to take Dr. Hetland's GD&T Intermediate & Advanced classes, which are offered as public seminars or can be taught directly at your company. One of the most significant benefits of doing the training at your facility is that it allows the utilization of company specific drawings. For more questions contact Dr. Hetland directly at greg-hetland@iigdt.com. |
|||||||||||||||||||||||||||||
|
|||||||||||||||||||||||||||||
 |
|||||||||||||||||||||||||||||
|
|||||||||||||||||||||||||||||

| Dr. Greg Hetland Phone: (612) 670-9311 |
IIGDT 12159 Quail Avenue Ln N |